Analytic Funnel#
Overview#
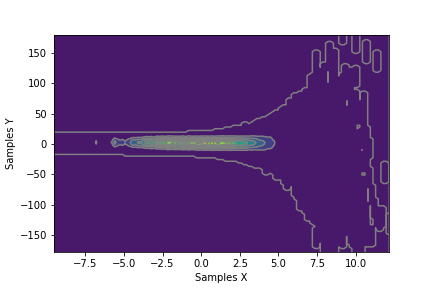
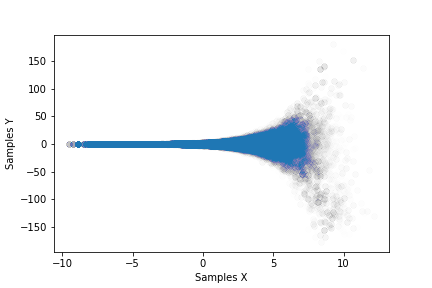
This benchmark consists of an analytically defined PDF \(\tau : \mathbb{R}^2 \rightarrow \mathbb{R}\) resembling the shape of a funnel.
Run#
docker run -it -p 4243:4243 linusseelinger/benchmark-analytic-funnel
Properties#
Model |
Description |
|---|---|
posterior |
Posterior density |
posterior#
Mapping |
Dimensions |
Description |
|---|---|---|
input |
[2] |
2D coordinates \(x \in \mathbb{R}^2\) |
output |
[1] |
Log PDF \(\tau\) evaluated at \(x\) |
Feature |
Supported |
|---|---|
Evaluate |
True |
Gradient |
True |
ApplyJacobian |
True |
ApplyHessian |
False |
Config |
Type |
Default |
Description |
|---|---|---|---|
None |
Mount directories#
Mount directory |
Purpose |
|---|---|
None |
Source code#
Description#
First, define a helper function
\[ f(x,m,s) := - \frac12 \log(2 \pi) - \log(s) - \frac12 ((x-m)/s)^2. \]
Now, the output log PDF is defined as
\[ \log(\tau(x)) := f(x_1, 0, 3) + f(x_2, 0, \exp(\frac12 x_1)). \]
This distribution is from Neal, Radford M. 2003, “Slice Sampling.” Annals of Statistics 31 (3): 705–67.